Visualizing
the Virus
Published
March 15, 2022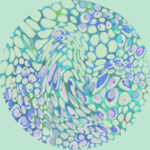


Work 1: Sonification: Every UK Covid 19 Death by Day, from March 5th 2020 to June 23rd 2020.
Every sound you hear represents one death from Covid 19 in the UK.
Every 30 seconds represents the timespan of one day, starting from the day of the first recorded death on March 5th. Refer to this timeline while listening.
Artist Statement:
In this process I collect and catalogue news and media on the days they happen, and represent each death with fragments of audio from these stories.
At the time of the June update there had been 42,927 UK deaths as on gov.uk. To represent each with a single sound has taken 55 minutes. The true estimated figure from ONS excess deaths was nearer 64,000.
I am now unmistakably in the thoughts of ‘how’, ‘why’, and ‘who’. But my main wish is to respectfully represent those who have lost their lives. I am interested in honest responses and I hope this work engages us to reflect on what has happened and is still happening around us.
This work was reviewed on DataJournalism.com by Duncan Geere and Miriam Quick: “This sonification by Jamie Perera uses the number of sounds in a time period to communicate UK COVID deaths between March and June last year. Each sound represents one death, and 30 seconds of sound represents one day of data – the entire piece lasts a harrowing 55 minutes. This scale humanises the numbers, the sonic equivalent of using one dot to represent one person in a data visualisation.”
Work 2: First Wave: A sonification of deaths from Coronavirus in the UK over 154 days, from 2nd March to 2nd August 2020.
A sonification of deaths from Coronavirus in the UK over 154 days, from 2nd March to 2nd August 2020 includes soundscapes from before, during and after lockdown, from conversation in pubs, planes overhead and school playgrounds to empty streets, footsteps in isolation, hospital ICUs and environmental sounds without humans. With recorded testimony from interviewed individuals, from frontline workers, to self-isolating vulnerable people, to near death survivors. Duration: 10 hours 20 minutes.
Acknowledgements:
This is a consolidation of “…We All Fall Down”, UK Coronavirus, A listening journey, originally commissioned by Crossover Labs. “…We All Fall Down” was featured in the Electric Dreams Festival 2020, where it was reviewed by David Pollock: “Were sound artist Jamie Perera’s works for Electric Dreams ever to be seen in a theatre they would certainly deserve the adjective ‘experimental’. We All Fall Down is a continuing live stream, ongoing throughout the festival, which weaves recordings of testimonies from the Covid-19 crisis through undefined performance elements. Tuning in after midnight on Friday, I heard what sounded like a nurse’s first-person relation of the stresses and fears of the Covid wards at the height of the crisis, set against a truly eerie backdrop of extremely minimal electronica and background chatter.”
Work 3: England Covid 19 Deaths by Day from March 1st to June 12th 2020. Harmonic Sonification.
Refer to this data visualization while listening.
Key
Kick drum: Day Markers (from 0.00)
Reverse cymbal: National Lockdown Mar 23rd (from 1.24)
Cello: Daily Hospital Deaths (from 1.44; red dots on chart)
Synth Pulse: Hospital Deaths 5-day Rolling Average (from 0:08; blue line on chart)
Strings: All Settings Deaths 5-day Rolling Average, deaths in all places (from 0:20; green line on chart)
High Violins: Excess deaths – the total amount of deaths above the 5 year average (from 0:52; grey blocks on chart)
Artist Statement:
Sonifying deaths from Covid 19 is not a decision I’ve taken lightly. It’s a process of emotional learning, of exploring issues whilst expressing the data responsibly; my feelings are secondary to the form being a catalyst for others to reflect on their experiences.
Sonification sits somewhere between information and emotion, whilst dealing with issues like data integrity, accuracy of representation, meaning, story and agenda. So nothing is perfect, the imperfection is embodied and is subject to what arises in the process of making.
For my part, it’s impossible to not have thoughts of ‘how’, ‘why’, and ‘who’, as more facts are researched and as more data is pored over. But right now, the overriding feeling is to respectfully represent those who have lost their lives. I am interested in honest responses and I hope this work engages us to reflect on what has happened and is still happening around us.
Acknowledgements:
Data for this sonification was collated by Thom Alex Day from the following sources:
https://www.england.nhs.uk/statistics/statistical-work-areas/covid-19-daily-deaths/
https://www.ons.gov.uk/peoplepopulationandcommunity/birthsdeathsandmarriages/deaths/datasets/weeklyprovisionalfiguresondeathsregisteredinenglandandwales
Sonification programming by Adrian Lewis.